A clean, responsive layout with filters for time periods (daily, weekly, monthly), industries, or specific metahuman roles (mentor, emotional support, virtual friend).

Download charts as PNG/PDF or data as CSV for further analysis.

Summary cards showing top-line stats like total interactions, average session duration, and sentiment score.

Role-based access and encrypted data to protect sensitive insights.
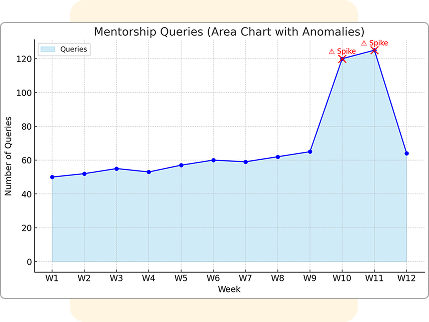
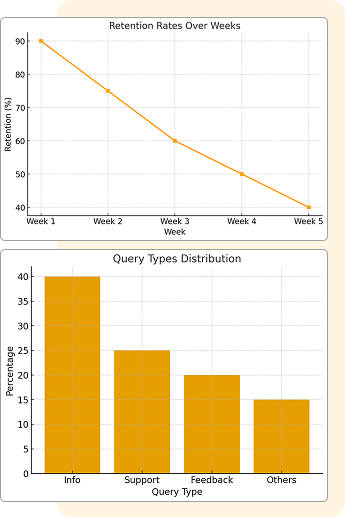
Monitor real-time metrics such as interaction frequency, user sentiment, query types, and retention rates. These insights reveal peak usage patterns and drop-off points, helping you optimize deployment strategies.
Create customizable reports in PDF, CSV, or interactive dashboard formats. Adapt them to your needs—for example, weekly student progress summaries or monthly retail trend analyses. Each report includes clear visualizations like charts, heatmaps, and trend lines for easy understanding.
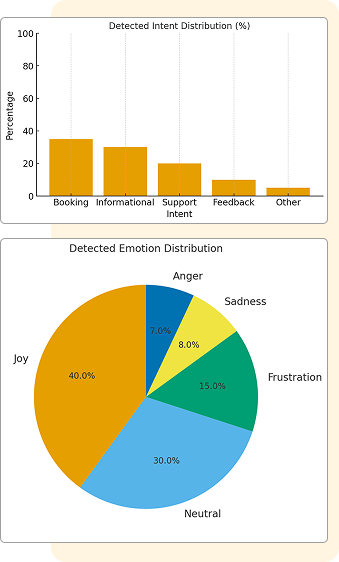
Go beyond surface-level data with deep learning models that detect user emotions (e.g., frustration in airport kiosk interactions) and intents (e.g., booking vs. informational queries), enabling proactive adjustments.
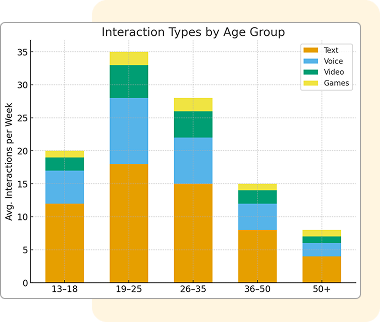
Break down data by demographics, location, or behavior patterns—e.g., how different age groups interact with a virtual friend metahuman in a social app.
Automatically flag unusual patterns, such as a spike in mentorship queries from students, alerting you to emerging needs or potential issues.